
TRON has been moving downward for the past few days after reaching its peak of $0.13 in mid-November. For the past seven months, the coin has been moving in the price range of $0.12 to $0.04. The TRX price correction is expected to reach its support line of $0.04, after which it may turn around and head towards its resistance of $0.12. In a week, the coin has declined by over 40%.
The investors may hope for an opportunity if the price of TRON begins to rise from its support zone and closes above the downtrend line. The bottom horizontal line has been a strong support line for the upliftment of TRX coins several times in the past. Even though the candle got tested at the support line in June and July but failed to close below it and decline further.
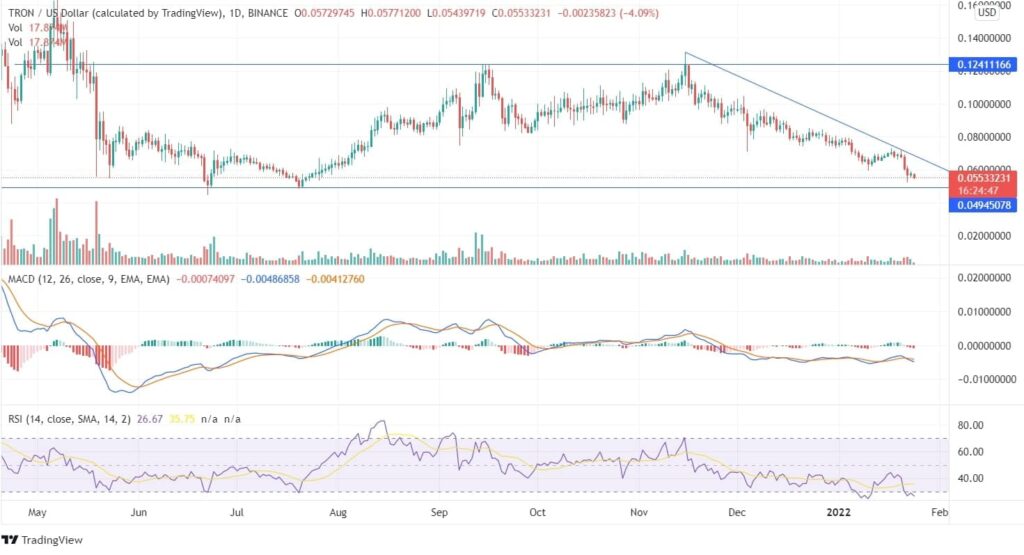
On the daily chart, the RSI indicator is trending under the oversold region, and the MACD line is currently trading below the signal line and is already in the bearish zone. Based on the current scenario, the bears may continue to push the price down to a minimum of $0.04. The investors should wait for the coin to close above or below the bottom horizontal line after getting tested there.
On the weekly chart, the technical pointers indicate a bearish trade since November, and the TRX coin has sloped 100% from that period. The price follows the down trend line and leads to the support line. In the current scenario, the technical parameters in the long run charts are already in the bearish zone. In the 4-hour chart, it’s neutral, so based on TRON coin price prediction, the investors should wait for a few days for an upcoming price movement before entering the trade.